Difference between revisions of "DPL:Gallery"
m |
|||
| Line 21: | Line 21: | ||
You can use DPL for creating visual representations of numeric values from different articles. I used this for visualizing the sizes of cell-phones. You can sort the tables according to different parameters. | You can use DPL for creating visual representations of numeric values from different articles. I used this for visualizing the sizes of cell-phones. You can sort the tables according to different parameters. | ||
| − | + | Have a closer look at: http://de.wiki-products.org/Dicke_von_Handys_im_Vergleich | |
[[Category:DPL Example]] | [[Category:DPL Example]] | ||
Revision as of 14:54, 7 June 2008
Using DPL: Examples for best practice
There are a lot of good ideas on how to use DPL, often in combination with other MediaWiki extensions.
If you have an example on your wiki which you want to share with us, please put a link below and give a short description what it is about.
Creating vertical bar charts with numeric properties from articles
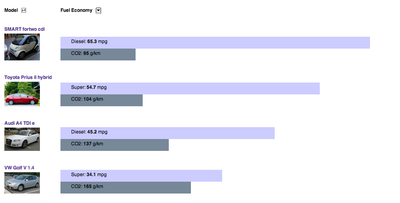
You can use DPL for creating sortable bar charts. In this example I used two templates, which are placed in the two columns of the sortable DPL-table. The template for "fuel economy" (Template:Car dpl2) contains two (borderless) tables with one row in each. To determine the width of each table I made use of one of the numerical parameters from the articles. This way the table turns into a nice bar chart representing a specific value. (There are some more features included, e.g. calculating the CO2-Emissions automatically if there is no value given, thus the template looks a bit complicated.)
Have a closer look at: http://en.wiki-products.org/Fuel_economy
A more elaborated (german) version is available at: http://de.wiki-products.org/Treibstoffverbrauch_pro_Sitzplatz
Creating graphic representations of numeric properties from articles
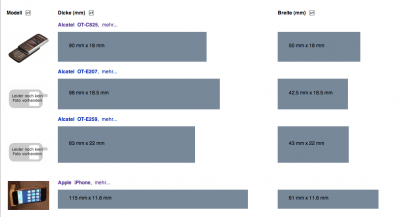
You can use DPL for creating visual representations of numeric values from different articles. I used this for visualizing the sizes of cell-phones. You can sort the tables according to different parameters.
Have a closer look at: http://de.wiki-products.org/Dicke_von_Handys_im_Vergleich

